The global regulatory status and commercialisation requirements of gene edited crops
Typesetting and website
I was commissioned to write a chapter on the changing regulations around the use if gene editing (GE) for crop improvement. In researching that field, I realised that visibility is a major challenge with many struggling to find up to date information of what regulations are in place and where. I decided that, as part of writing the chapter, I would produce visual tools to help others in navigating this space.
There are four groups of visual components I produced with this project:
- Graphical maps
- Typeset report
- Dedicated website
- Interactive web tool
Graphical maps
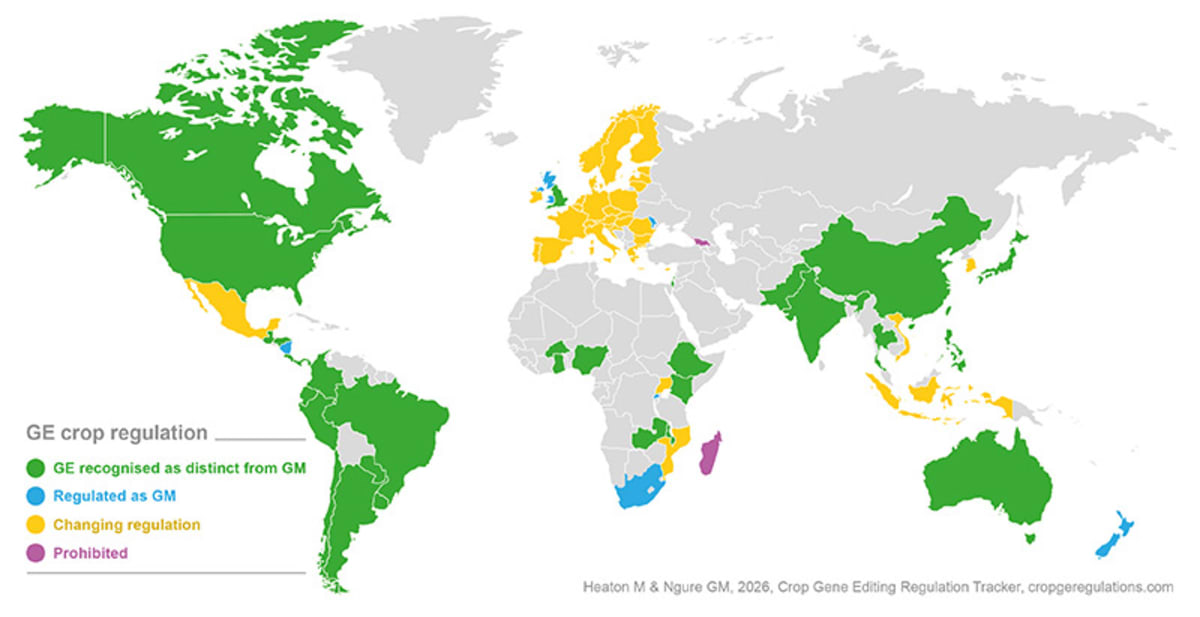
The clearest way to show global regulatory position and change is through chloropeth maps coloured by GE recognition status. Such maps have been published before, but tend to suffer from two problems:
- They are out of date. The regulatory space is changing quickly, causing published maps in static articles to fall behind the current global regulatory status.
- They are difficult to access and share. Many are published in academic journals not everyone has access to. Others are posted on websites at low resolutions for sharing.
I’ll explain how I’ve tried to address both challenge above, for the long-term, but the first step was making the maps.
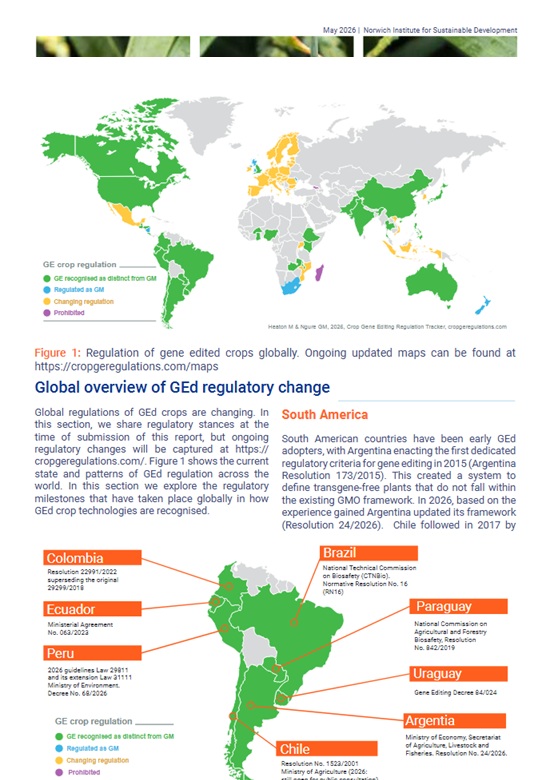
Making the maps in Illustrator was easy, drawing on a creative commons global map file I’ve had for years. Then it was simply a case of colouring the jurisdictions and adding a key. I then created art boards focusing on different continents. I then created versions of these maps for the chapter labelling the different regulations across the continents.
Typeset report
The rate of regulatory change means that I knew researchers and regulators who wanted access to the maps we were making so we decided to publish a pre-print version of the chapter to immediately share an update.
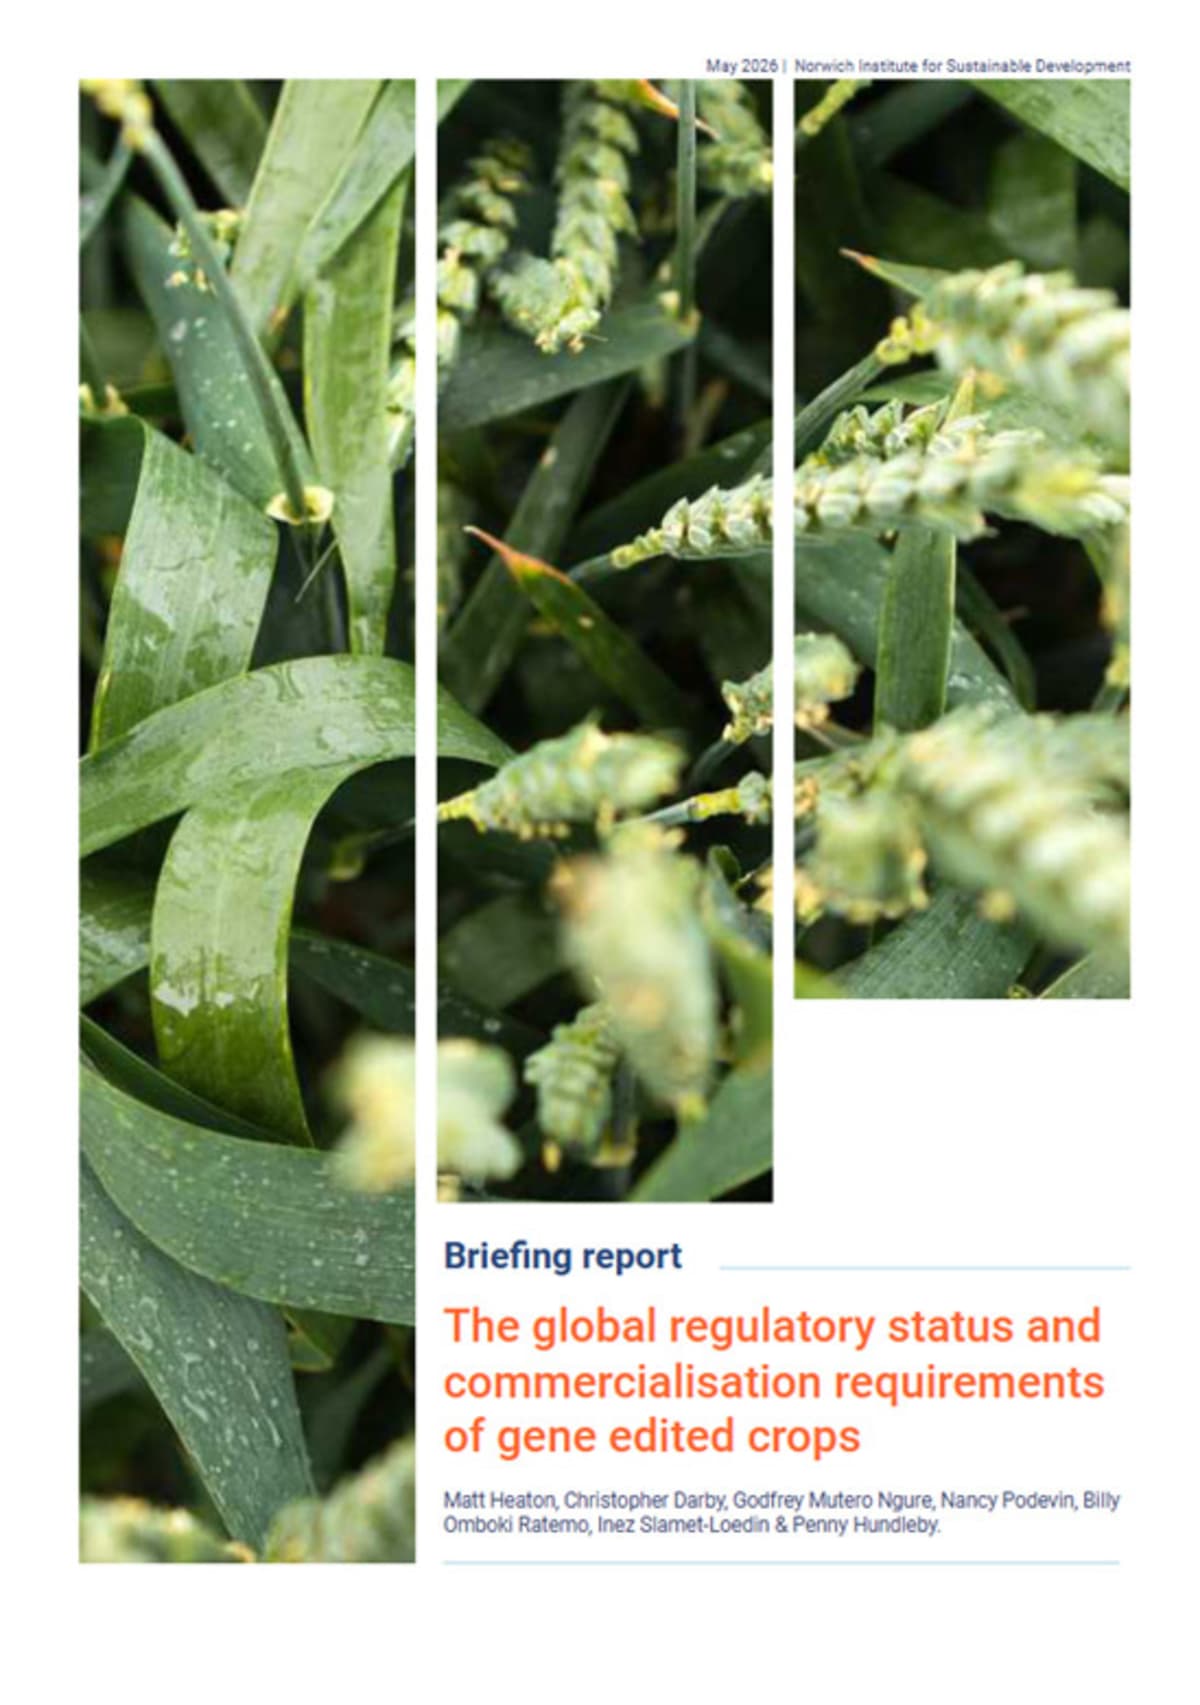
Here’s a link to the report “The global regulatory status and commercialisation requirements of gene edited crops”.
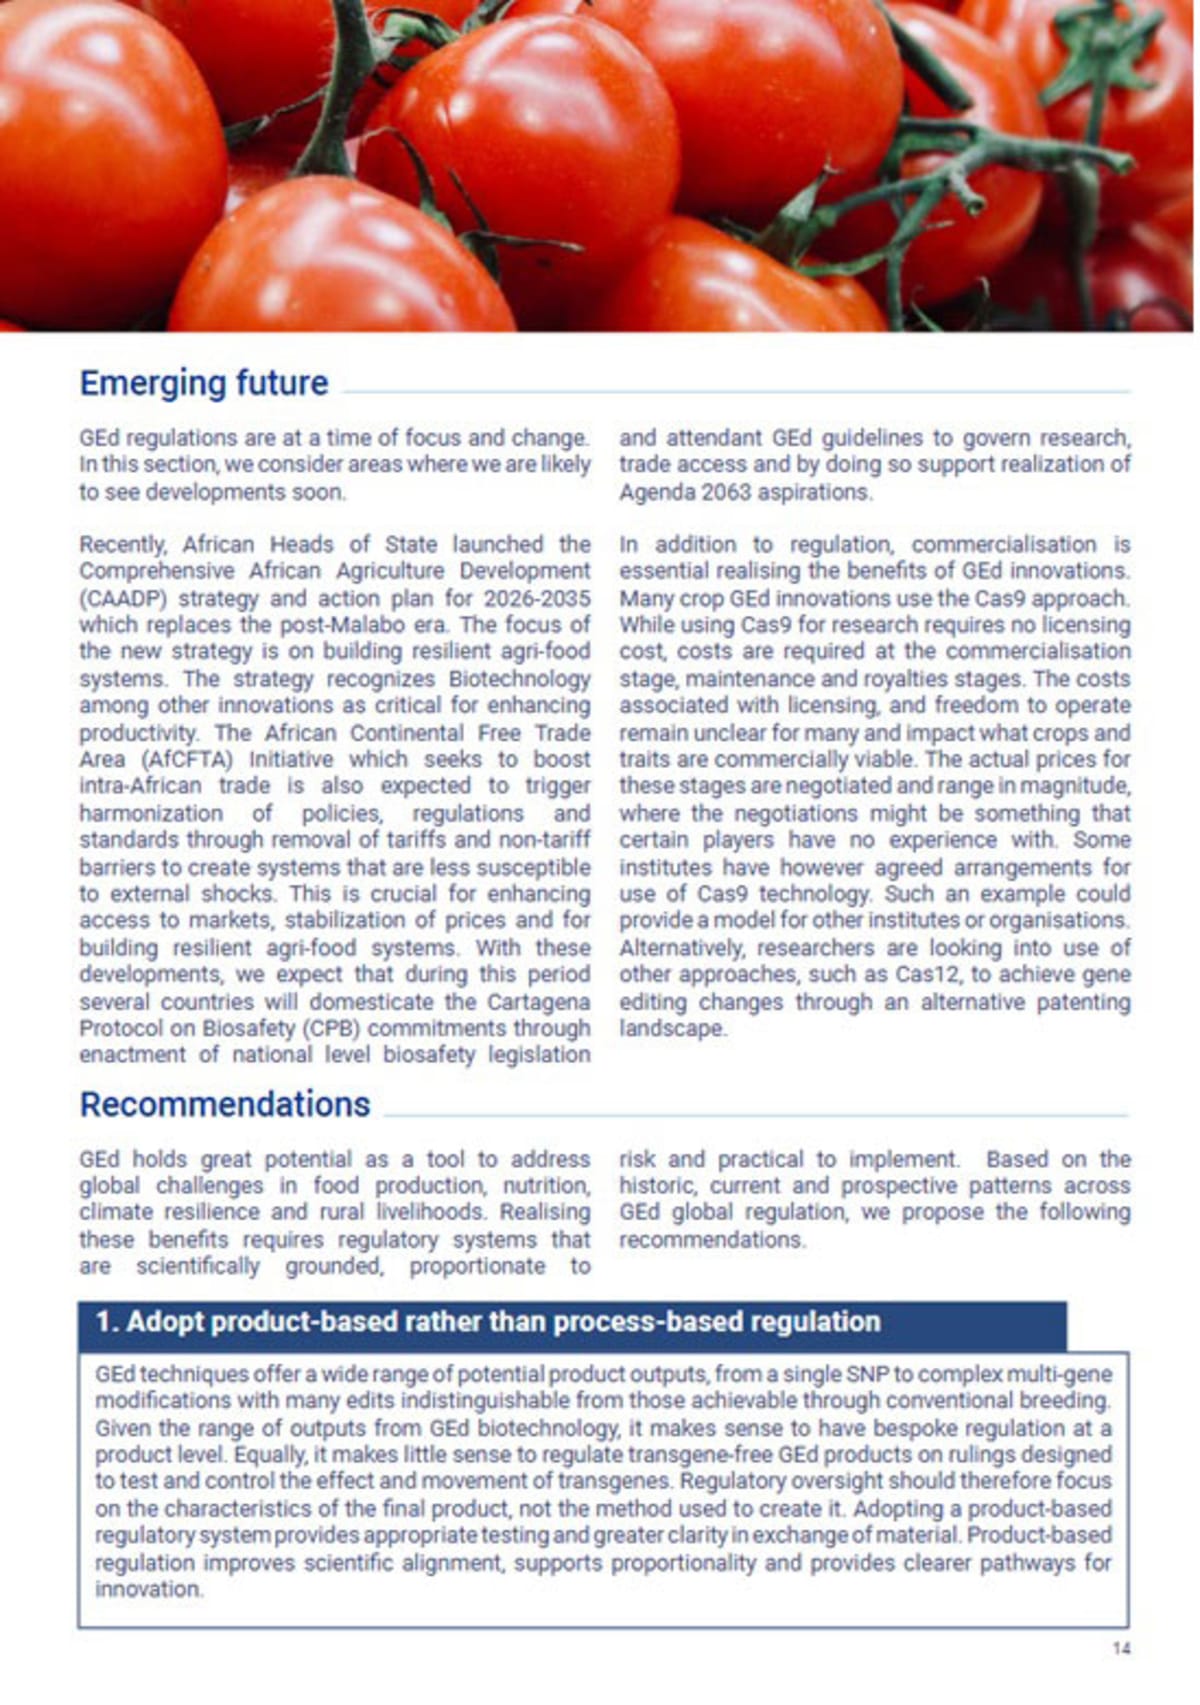
The report was typeset in Adobe InDesign using templates I made to follow the NISD style (as I conducted this research from my NISD position). Here’s the cover.
And an example from the inner:
Dedicated website
We had a great response from the report but, as mentioned earlier, the rate of regulatory change means that static documents quite quickly fall out of date. We therefore decided to make a live, updatable resource stays abreast of regulatory changes and provides this information as easily downloadable maps.
In April 2026, we launched cropgeregulations.com. The site provides an overview of global regulatory change and offers this as downloadable high-resolution image files for users to use and share.
I wanted this site to be extremely straightforward and minimalist in design. I’ve made many website over the years and something that has been bothering me more recently is the visual clutter that has crept into so many sites. For this site, I wanted every page to be simple and every image to be essential. Straight to the point and a easy to use tool for individuals to navigate from anywhere.
Amazingly, the site is now the leading GE regulatory tracking website in the world.
The website runs on BearBlog, which is a lightweight blogging platform that has been perfect. The site uses one of the BearBlog basic themes with a few edits to the CSS to control fonts, headings and spacing.
Interactive web tool
The static maps I made were well received, but a repeated request was for an interactive tool to help users browse global regulations.
In response, I added an interactive map by hosting it on GitHub and embedding it in the page with an iframe. The tool maps regulatory status for recognition of GE crop products, as well as summaries of these regulations across countries and links to the regulation forms - here’s a breakdown of what it offers.
The map is built using JavaScript drawing on a JSON file which contains the regulatory data and maps it using ISO codes. Since the tool is hosted on GitHub, it can be displayed on any site or location which can host an iframe.